Dashboard
Dashboard
The Dashboard is your central command center for FileFlows. It provides a real-time overview of your file processing environment so you can see exactly what's happening across your servers, libraries, and flows at a glance.
Tabs
The Dashboard is organized into tabs, each focused on a different aspect of your system:
Overview
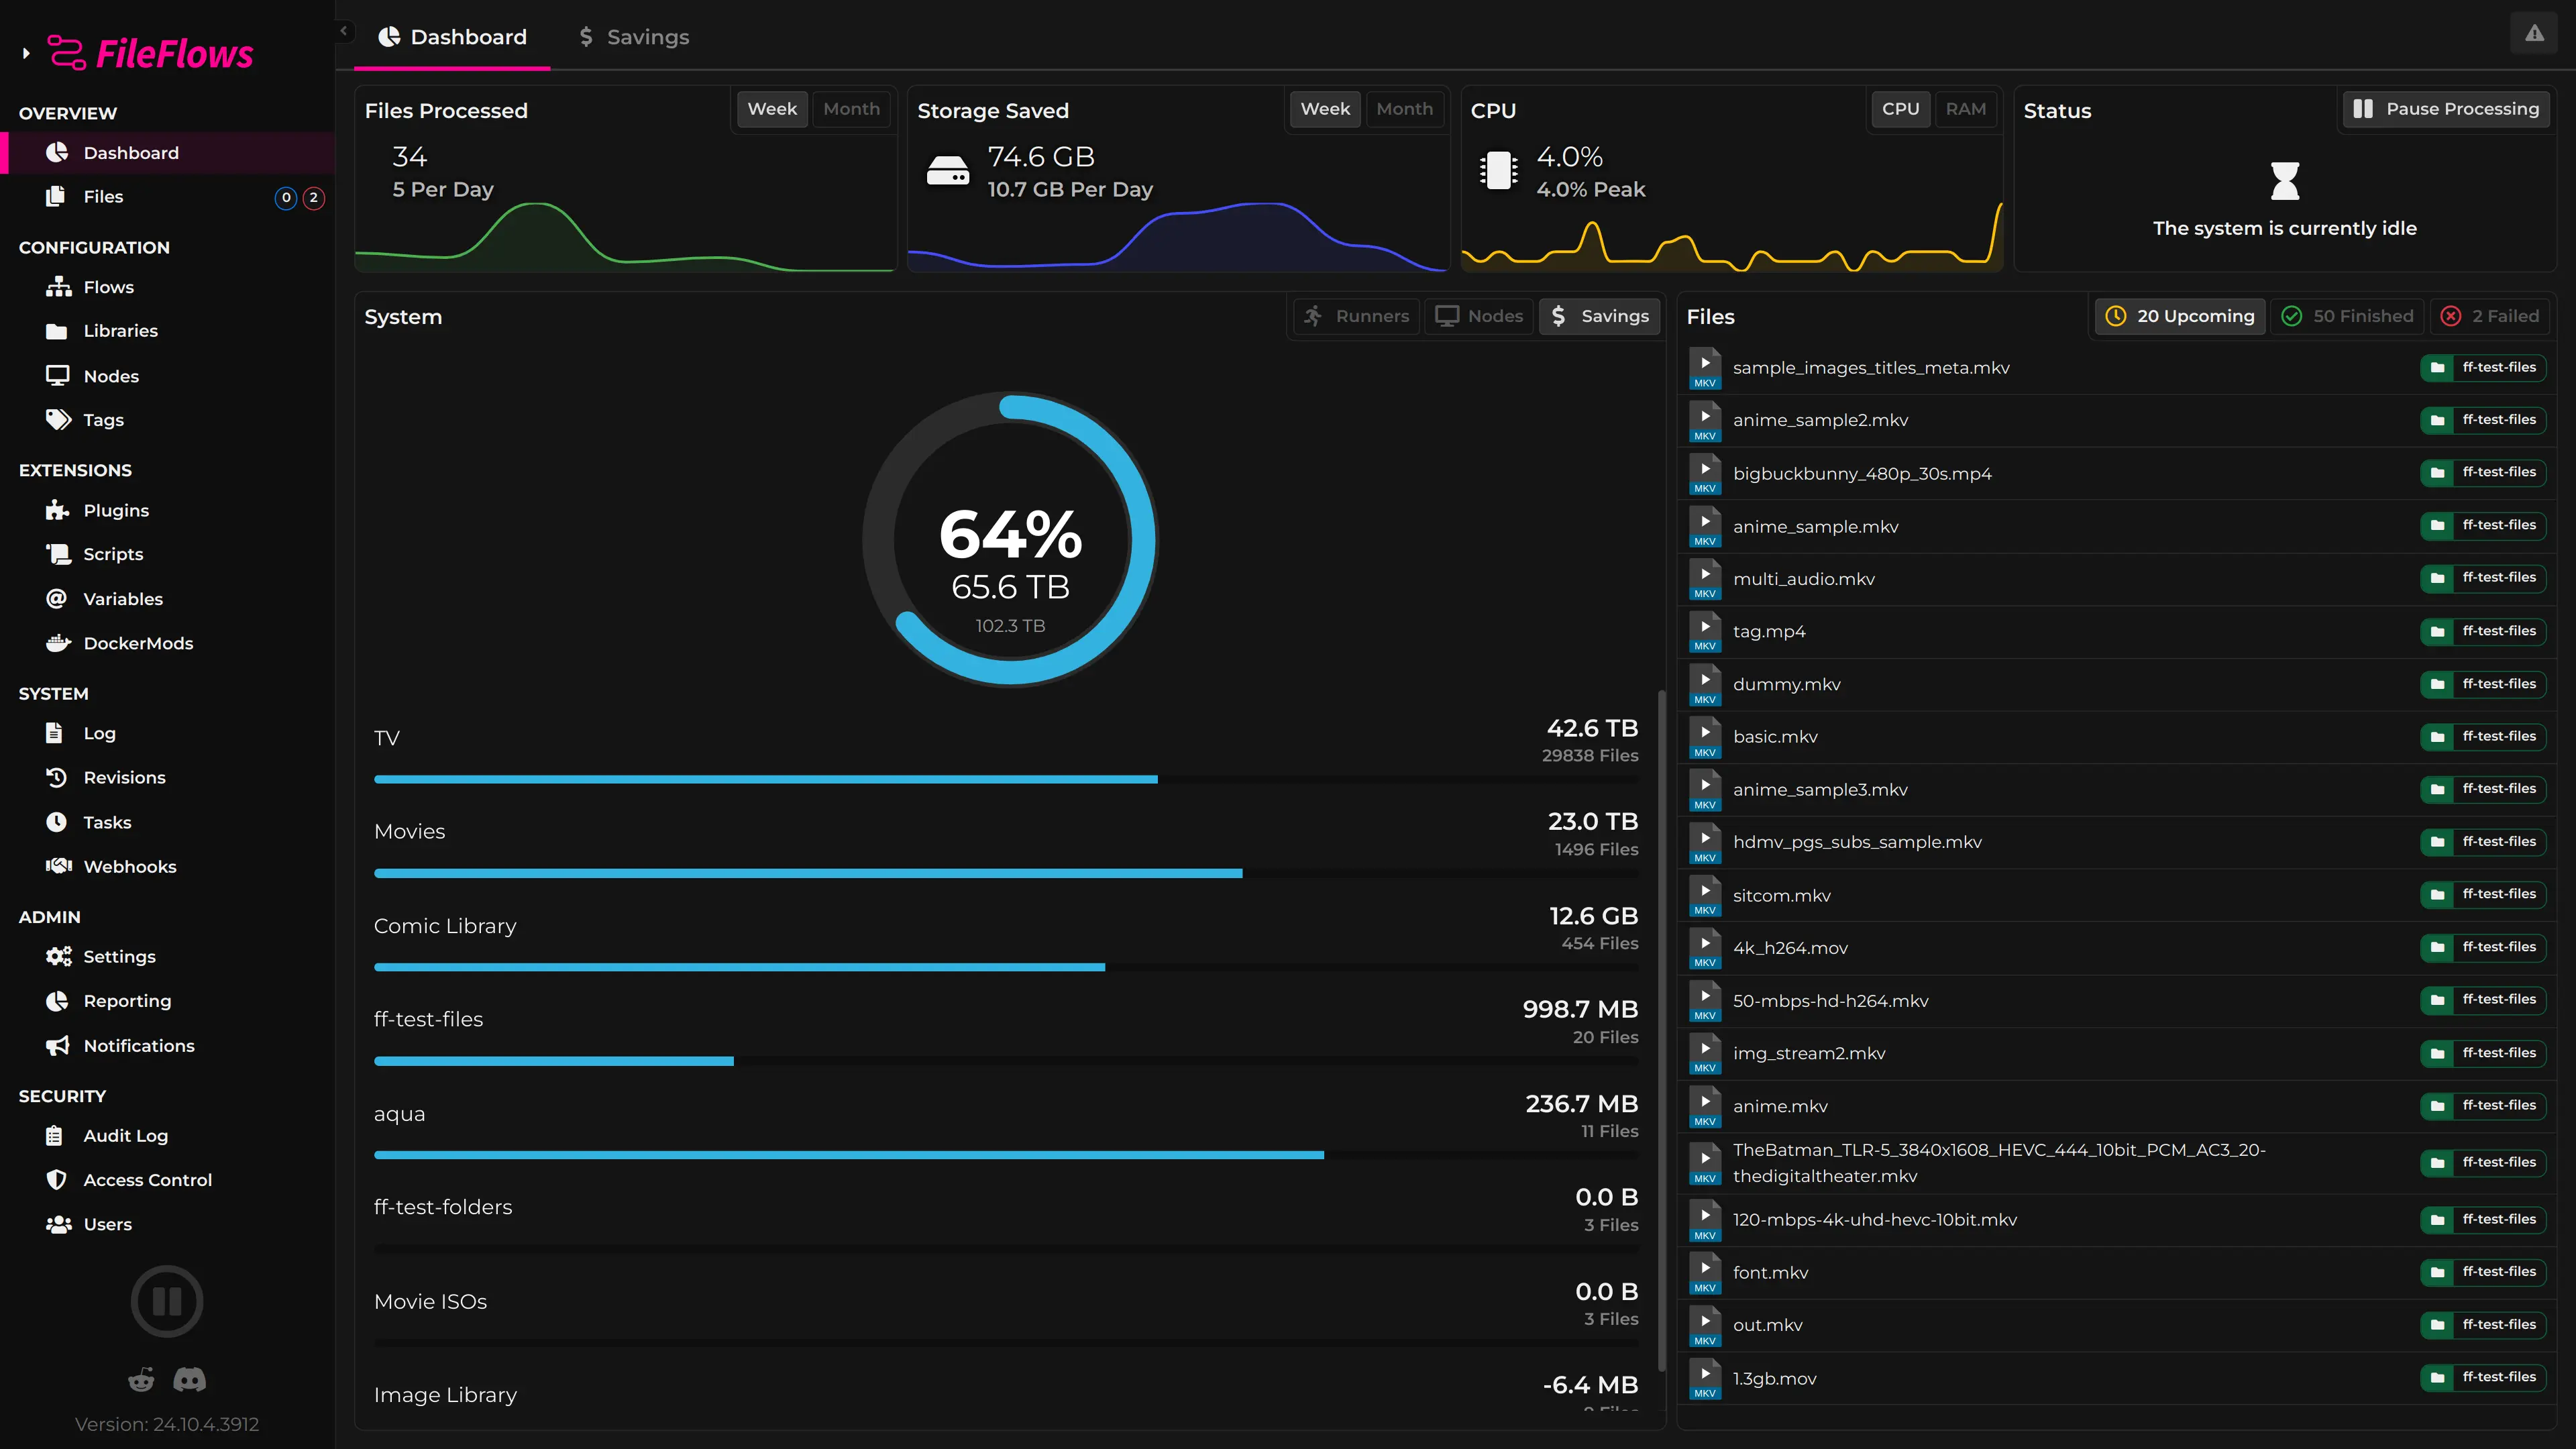
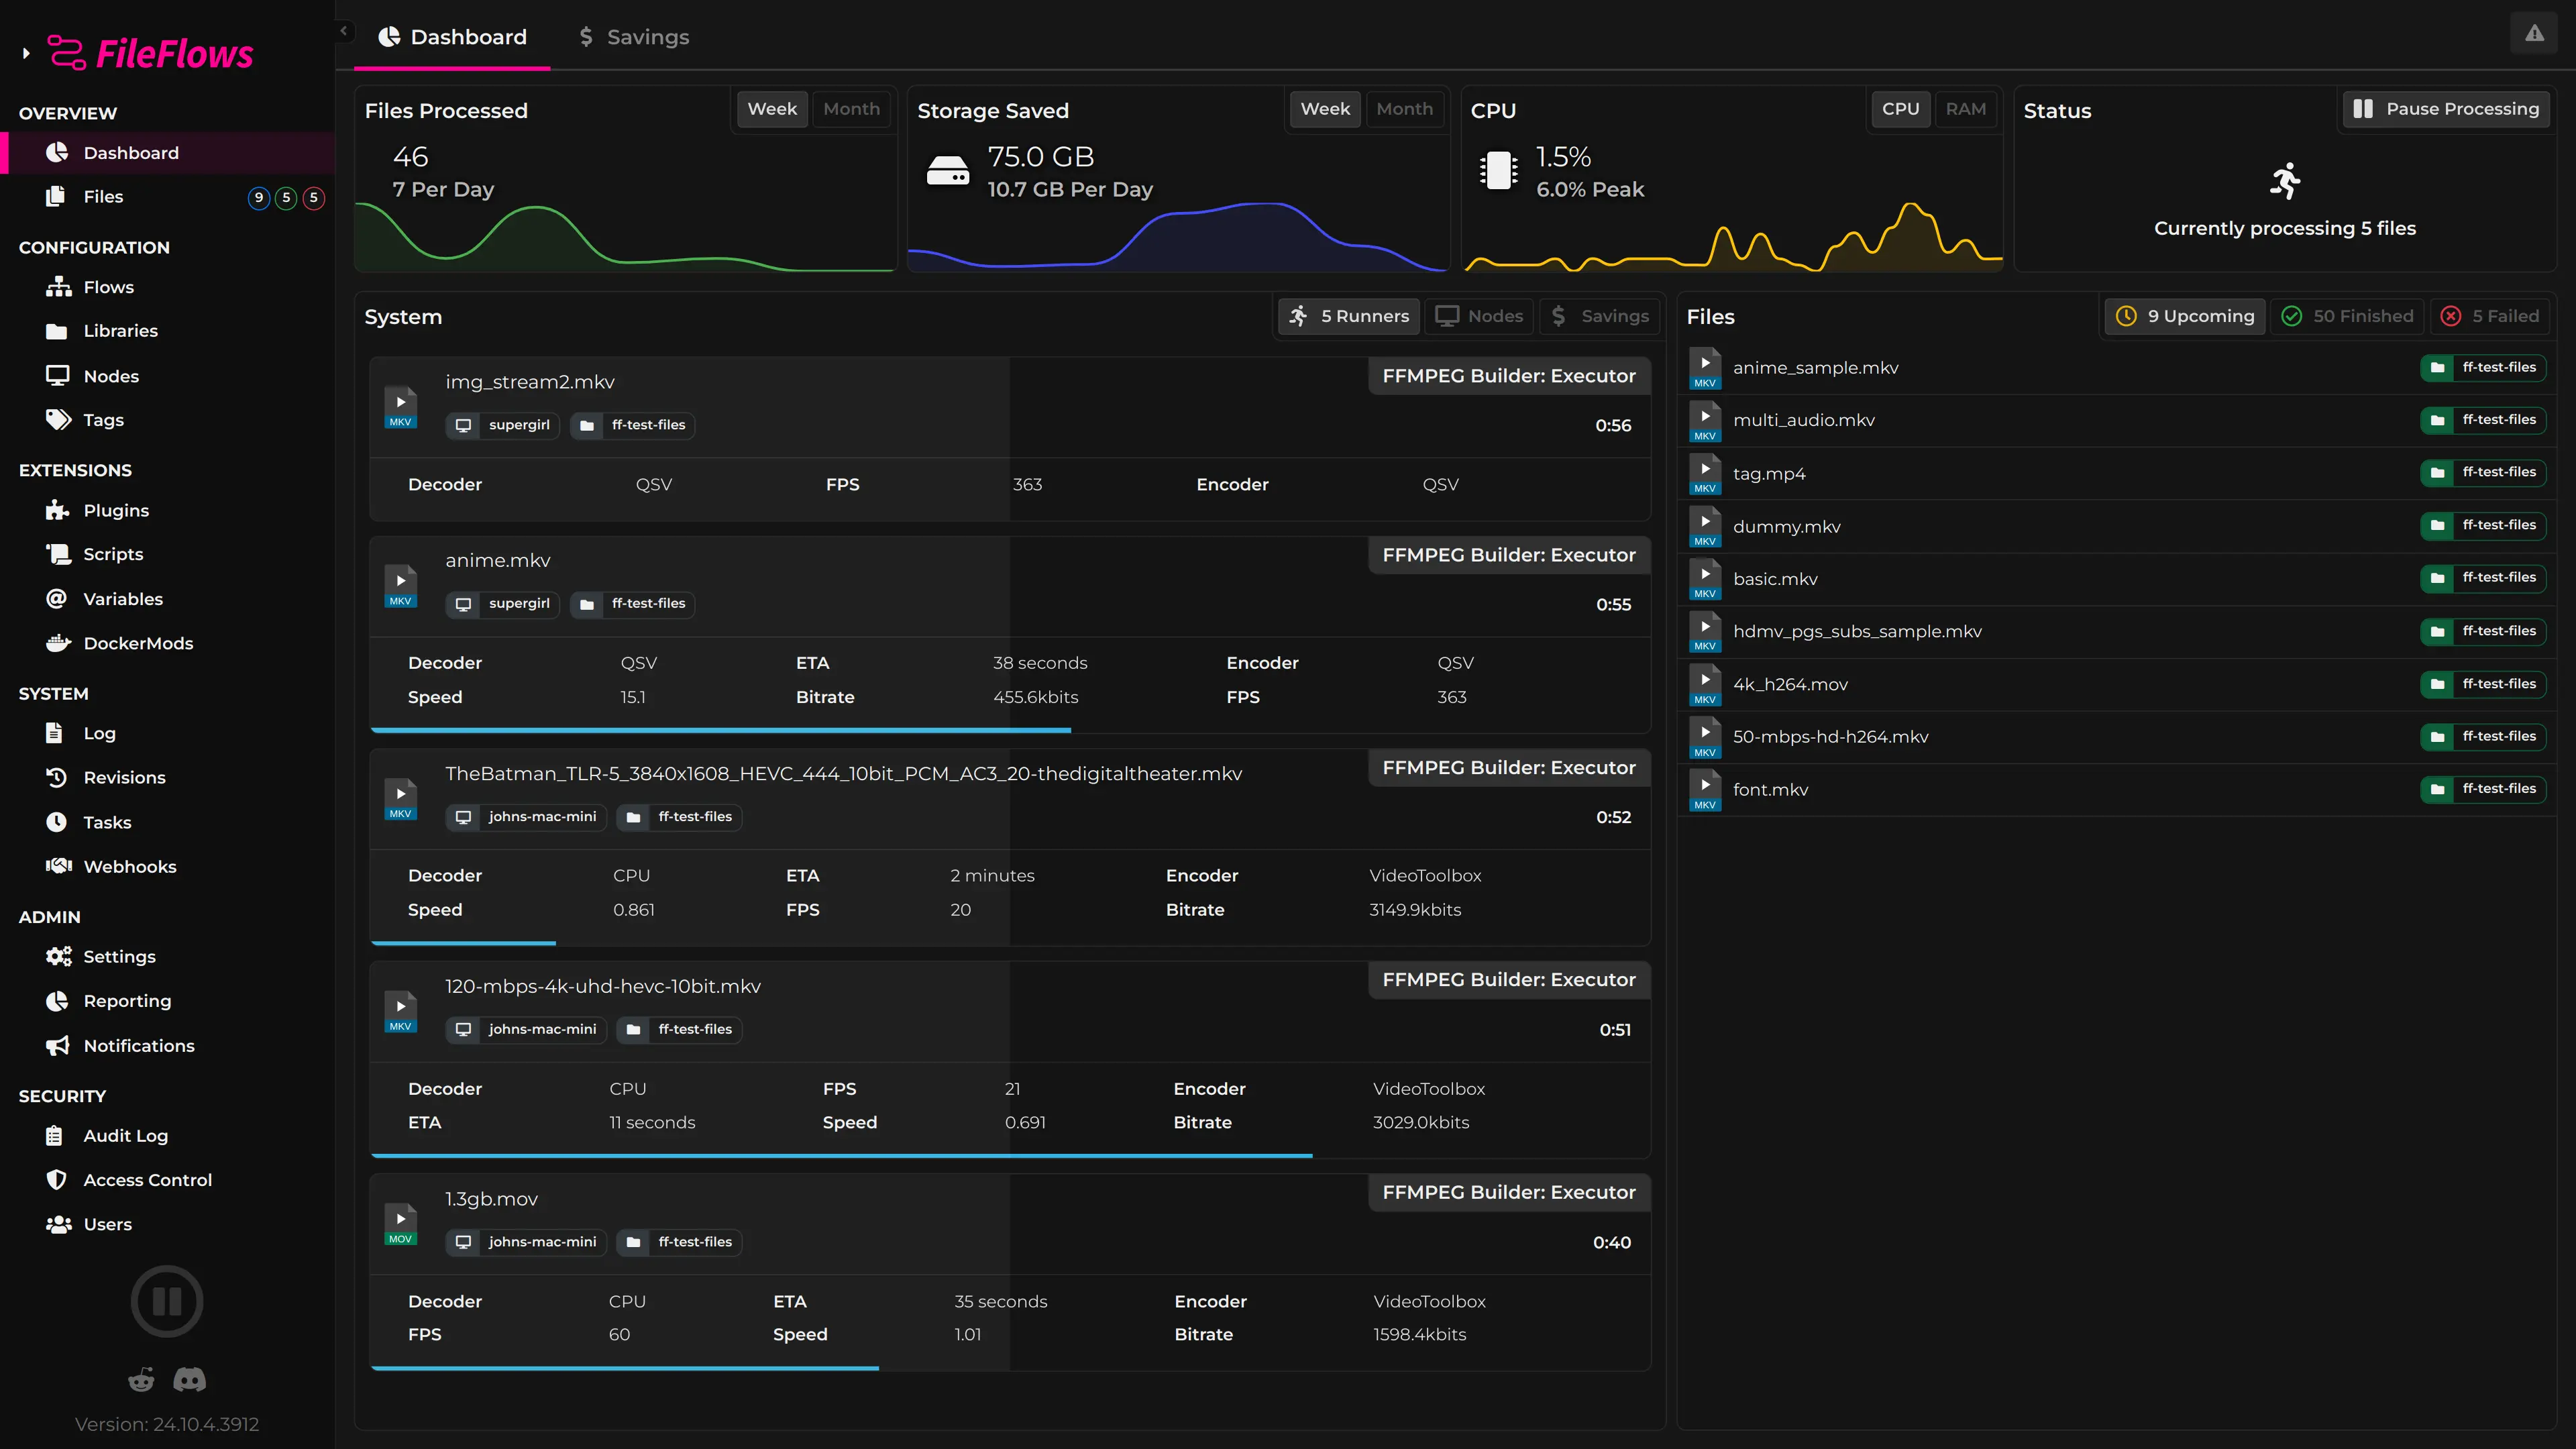
The Overview tab gives you a quick snapshot of the system status:
- Upcoming Files — Files currently queued for processing or actively being processed. See what's next and double-click any file to view its processing log.
- Recently Processed — Files that have recently completed processing, showing outcomes and status.
- Failed Files — Files that encountered errors during processing. Click to view the log and diagnose issues.
- Processing Nodes — A view of every registered node, its online status, and resource usage. This is the same view you get from the Nodes page.
- Library Savings — A running total of storage space saved across all libraries thanks to FileFlows processing. Click through for a detailed breakdown.
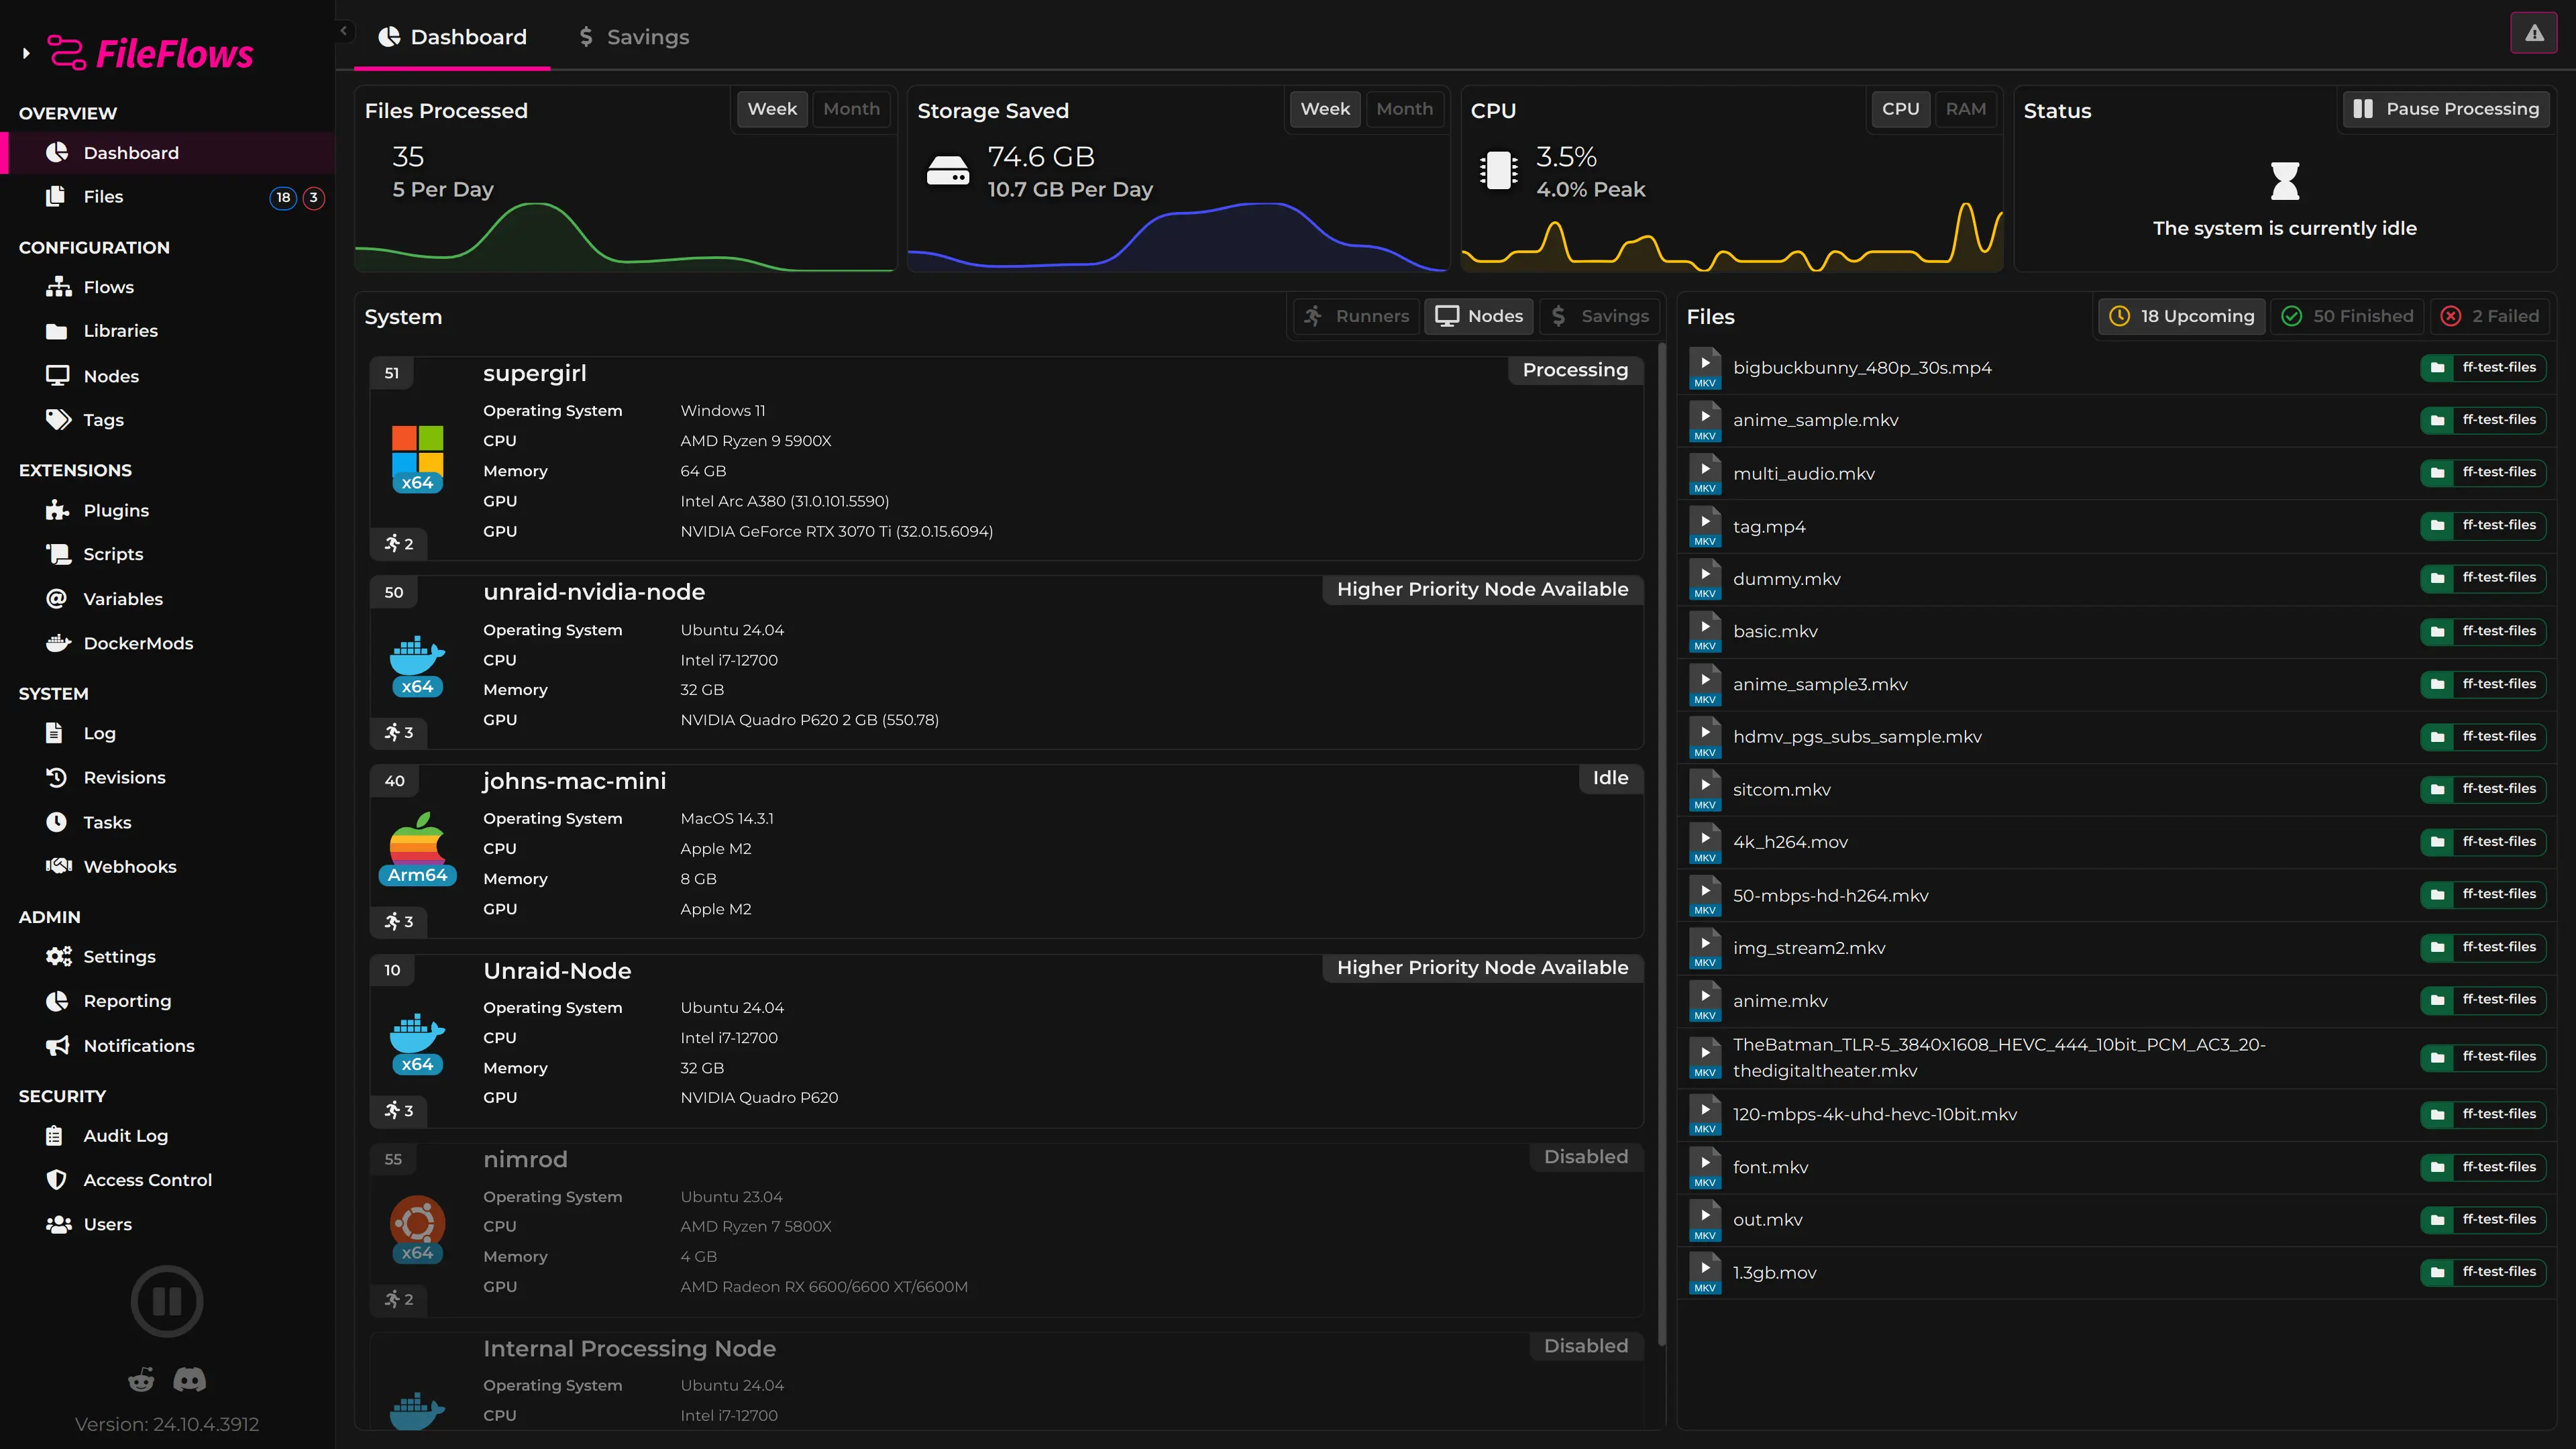
Nodes
The Nodes tab provides a dedicated view of all registered Processing Nodes. You can see each node's status, resource utilization, and current workload without leaving the Dashboard.
Dashboard Nodes Tab
Savings
The Savings tab breaks down storage savings by library, making it easy to see which libraries are benefiting most from FileFlows processing and how much space you're reclaiming.
Dashboard Savings Tab